Security Event
Security Events indicate a possible compromise, attack, or abnormal behavior of the web application. Polaris logs all these events as well as the platform's response to the events, whether it was blocked or allowed etc. Security events may be viewed, exported, and linked to other security event features in Polaris such as incident response.
Accessing Security Events
Monitoring these security events is crucial in staying ahead of attackers and investigating any incidents. The steps below illustrate how you can view the security events in Polaris.

Under the selected site, click on Security Center.
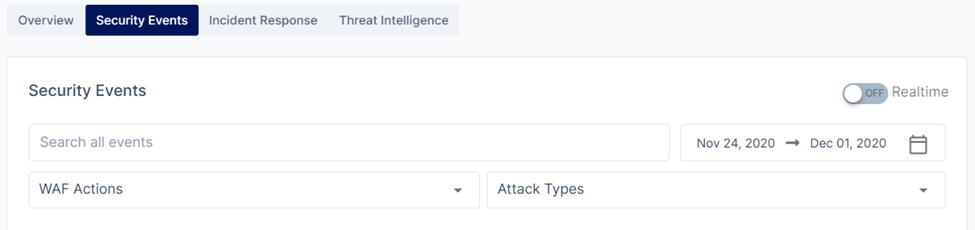
Click on the Security Events tab.
The list of security events can be filtered by:
- Name
- Date
- Action that was taken by the WAF (i.e. Blocked, Identify, Warning...)
- Attack Type (i.e. SQLI, DOS, XSS...)
Definitions of the different actions taken by Polaris:
Allowed: Polaris allows the request to be forwarded for processing and response.
Blocked: The request is denied and responded to with a HTTP 403 (Forbidden) status code.
JS challenge: : Polaris will run a JavaScript validation challenge before the user can view the content.
Captcha: Polaris will display a captcha challenge before the user can view the content.
Log: Polaris will log it as a security event if it matches the custom rule's action.
Identifyg: Polaris will log it as a security event if it matches the custom rule's setting of Browser Integrity Check.
Warning: Polaris identifies this as suspicious activity and the request will not be blocked but will
be marked with a warning tag in the security events tab for further investigation.
Viewing Security Logs
After selecting the filters stated above, a list of security events matching it will display accordingly. Click on any event to view more information about it:
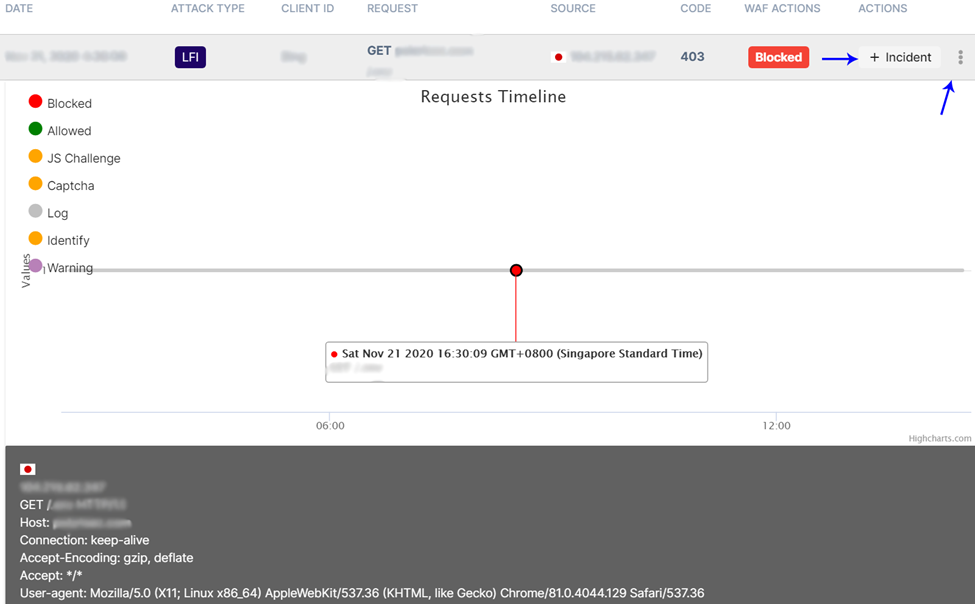 Clicking on an event allows you to view detailed information about it. You may also create
an incident or take additional actions based on the selected event.
Clicking on an event allows you to view detailed information about it. You may also create
an incident or take additional actions based on the selected event.
Creating an Incident Ticket
Creating an incident allows you to highlight a particular event and revisit it anytime without having to go through the trouble of looking for it using the filters. This is particularly useful if Polaris is being managed by multiple people and the website has high traffic, generating a large number of events daily.
To create an incident, click on the + Incident button under Actions of the selected security
event (refer to the blue arrow in the above image):
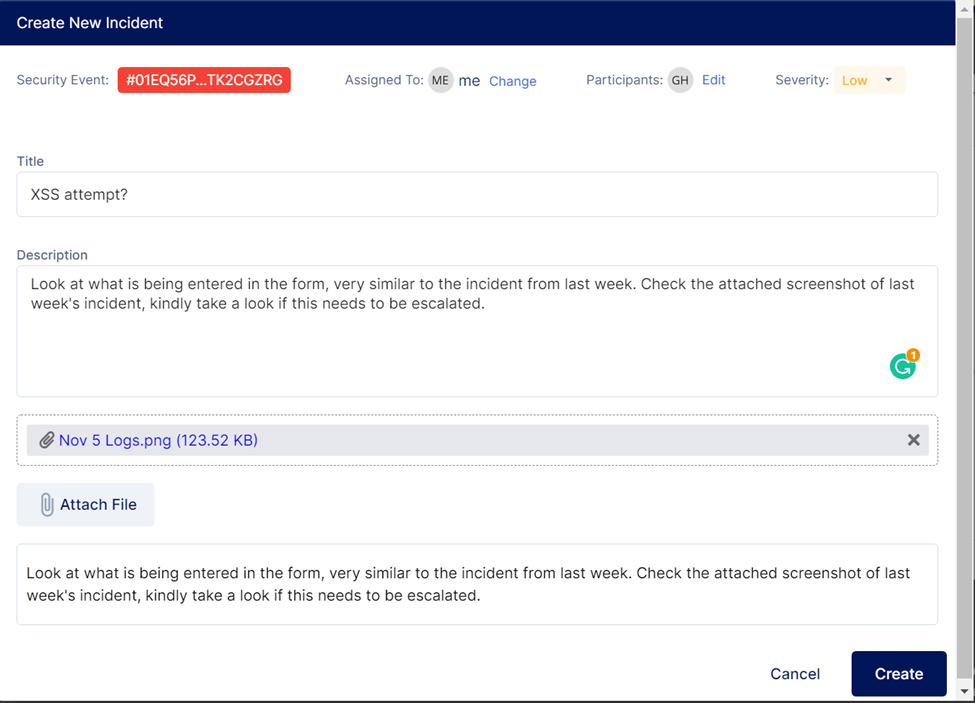 A pop-up box will appear for you to configure the incident and enter details.
You may assign and add participants for them to take note of and monitor this incident. You may also set the severity to help categorize and bring attention to more important incidents. The 5 available severity levels are:
- None
- Low
- Medium
- High
- Critical
You may also add a title, description, and attach relevant files for reference.
Apart from creating an incident, you may also Whitelist or Blacklist the IP address of the client
and there is also an option to mark the event as a false positive. This can be done by clicking on
the 3 dots under Action beside the + Incident button.
Exporting Security Incident
You may export an incident by using the 'Export' function located below the list of security events
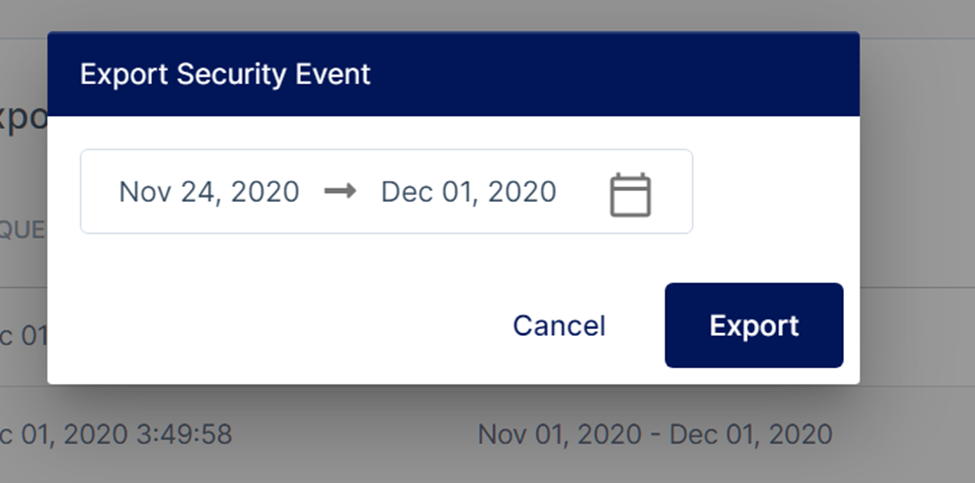 Select the date and export.
Once the export is complete, the status will show 'done' and an option to download will appear.
Check out this article if you are looking to download access logs instead: Logs.