Service Monitor
Polaris allows you to monitor your resources and ensure that key resources are always available and accessible at all times. This function is compatible with any resource that can be accessed through a URL and is highly customizable to suit your needs.
Accessing Service Monitor
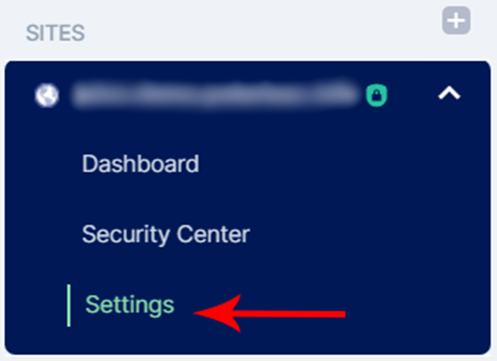
Under Sites, click on Settings.
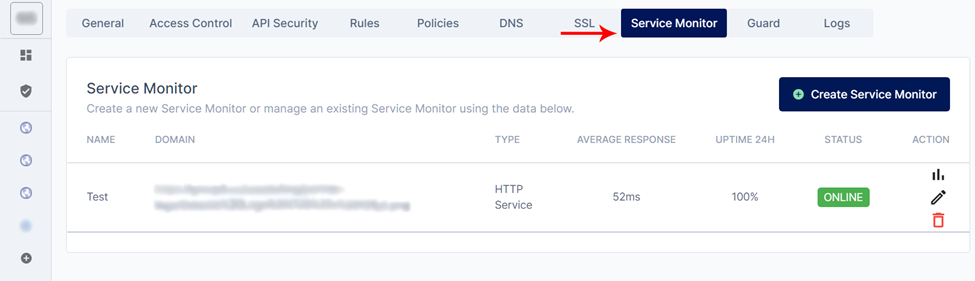
Look for Service Monitor on the horizontal sliding menu.
Adding a resource
To add a resource, click the + Service Monitor button and fill in the necessary details:
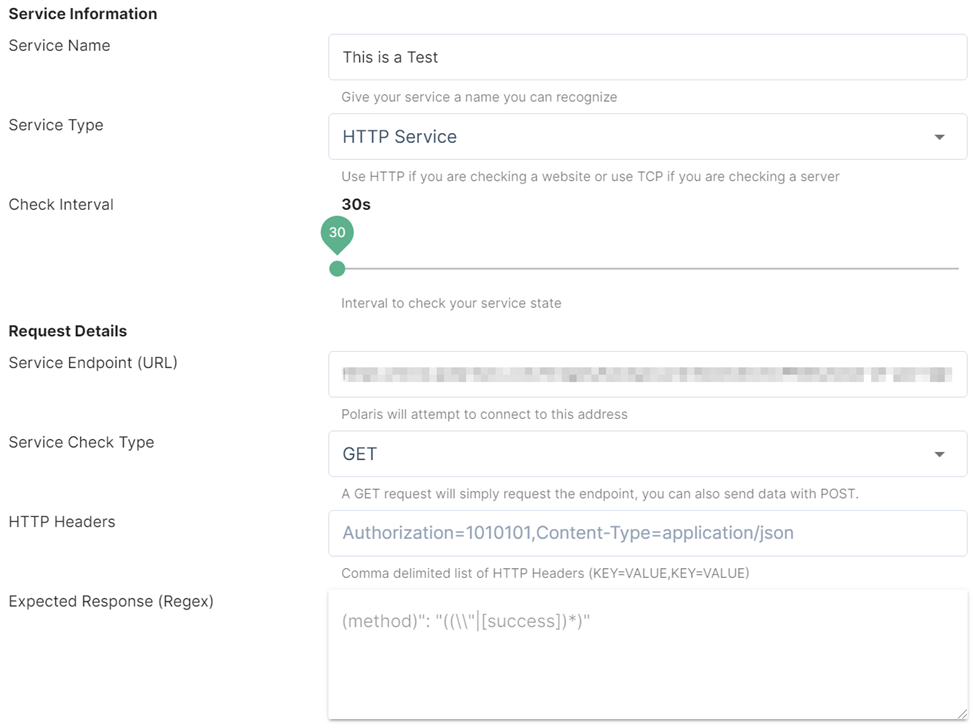
- Set a Service Name to identify the resource.
- Select the Service Type: HTTP / TCP / UDP / ICMP / gRPC
- Pick the duration of the check interval. It ranges anywhere from 30 seconds to 1800 seconds.
- Enter the resource to be monitored and note any other necessary details.
For HTTP: Enter the HTTP Status Code & select the service check type (GET / POST /DELETE / PATCH / PUT) HTTP Headers & Expected Response are optional.
For TCP & UDP: Enter the port number
For ICMP & GCRP: No additional details needed.
- Pick the duration of request timeout which ranges anywhere from 1 second to 180 seconds.
For example, if the check interval is 30 seconds and the request timeout is 5 seconds, Polaris will probe the resource every 30 seconds, and if the expected response is received within 5 seconds, the resource is considered to be online. If not, it will be reflected as downtime and marked as offline.
Monitoring resource
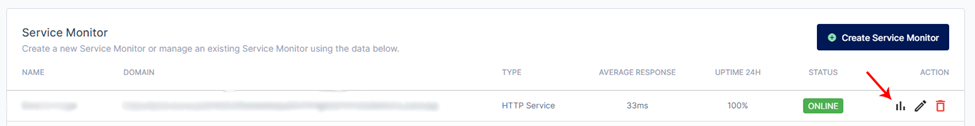
Under Action, click on the graph icon to monitor the resource (as indicated by the red
arrow).
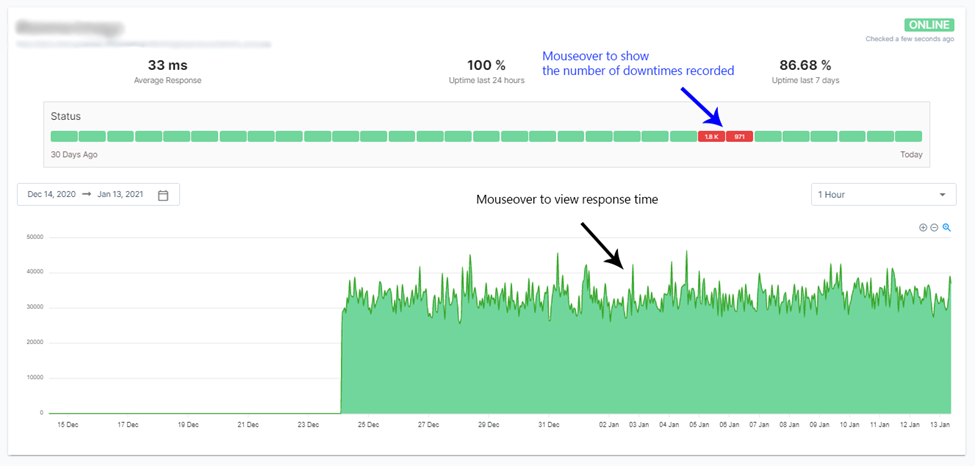
Polaris displays the following information for monitoring a resource:
- Average Response time
- % of uptime in the past 24 hours
- % of uptime in the past 7 days
- Graph displaying response time and uptime in detail
The graph can be customized:
- Range of date displayed
- The interval between each point on X-axis
- Size of the graph (Zoom In/Out)